Grundlæggende statistik
| Institutionelle ejere | 108 total, 100 long only, 0 short only, 8 long/short - change of % MRQ |
| Gennemsnitlig porteføljeallokering | 0.5124 % - change of % MRQ |
| Institutionelle aktier (lange) | 18.942.128 (ex 13D/G) |
| Institutionel værdi (lang) | $ 346.332 USD ($1000) |
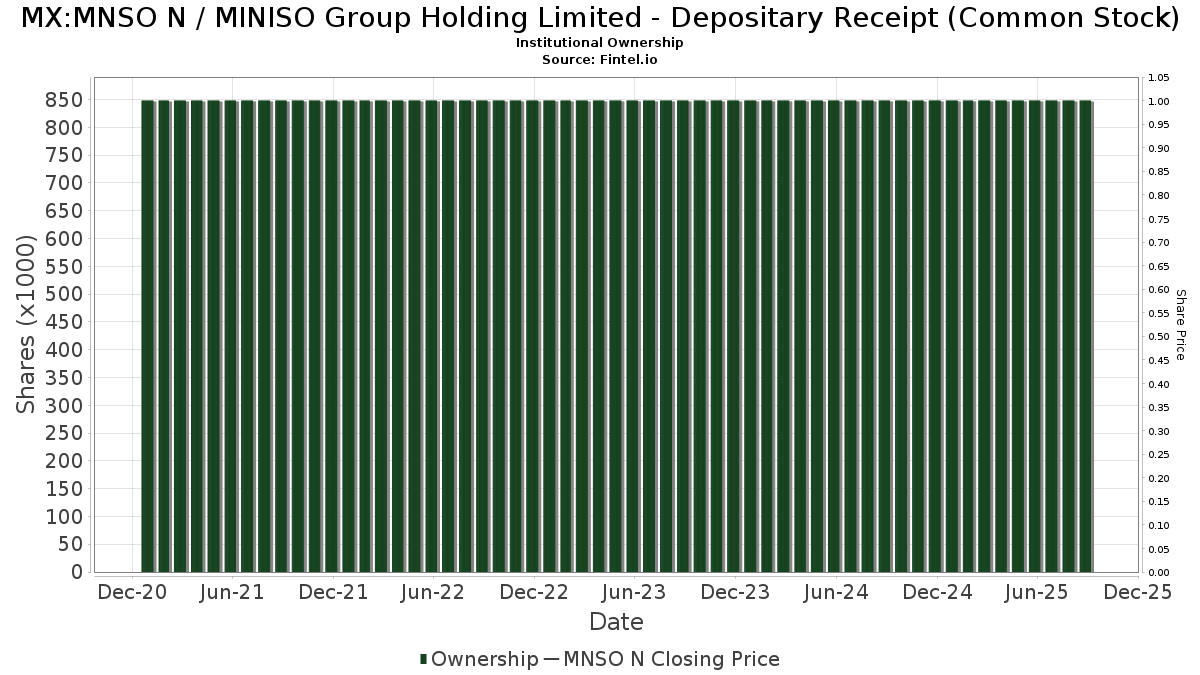
Institutionelt ejerskab og aktionærer
MINISO Group Holding Limited - Depositary Receipt (Common Stock) (MX:MNSO N) har 108 institutionelle ejere og aktionærer, der har indsendt 13D/G- eller 13F-formularer til Securities Exchange Commission (SEC). Disse institutioner har i alt 18,942,128 aktier. Største aktionærer omfatter Norges Bank, KEYWISE CAPITAL MANAGEMENT (HK) Ltd, Serenity Capital Management Pte. Ltd., Orbis Allan Gray Ltd, Millennium Management Llc, UBS Group AG, Sequoia China Equity Partners (Hong Kong) Ltd, Point72 Asset Management, L.P., State Street Corp, and Crossmark Global Holdings, Inc. .
MINISO Group Holding Limited - Depositary Receipt (Common Stock) (BMV:MNSO N) institutionel ejerskabsstruktur viser aktuelle positioner i virksomheden efter institutioner og fonde, samt seneste ændringer i positionsstørrelse. Større aktionærer kan omfatte individuelle investorer, investeringsforeninger, hedgefonde eller institutioner. Skema 13D angiver, at investoren besidder (eller besidder) mere end 5 % af virksomheden og har til hensigt (eller har til hensigt at) aktivt at forfølge en ændring i forretningsstrategi. Skema 13G indikerer en passiv investering på over 5%.
Fondens stemningsscore
Fund Sentiment Score (fka Ownership Accumulation Score) finder de aktier, der bliver mest købt af fonde. Det er resultatet af en sofistikeret, multi-faktor kvantitativ model, der identificerer virksomheder med de højeste niveauer af institutionel akkumulering. Scoringsmodellen bruger en kombination af den samlede stigning i oplyste ejere, ændringerne i porteføljeallokeringer i disse ejere og andre målinger. Tallet går fra 0 til 100, hvor højere tal indikerer et højere niveau af akkumulering for sine jævnaldrende, og 50 er gennemsnittet.
Opdateringsfrekvens: Dagligt
Se Ownership Explorer, som giver en liste over højest rangerende virksomheder.
AI+ Ask Fintel’s AI assistant about MINISO Group Holding Limited - Depositary Receipt (Common Stock).
Select a question to share a public post with an AI-crafted answer.
Thinking of good questions…
13F og NPORT arkivering
Detaljer om 13F-arkivering er gratis. Detaljer om NP-ansøgninger kræver et premium-medlemskab. Grønne rækker angiver nye positioner. Røde rækker angiver lukkede positioner. Klik på linket ikon for at se den fulde transaktionshistorik.
Opgrader
for at låse premium-data op og eksportere til Excel ![]() .
.
| Fil dato | Kilde | Investor | Type | Gennemsnitlig pris (Øst) |
Aktier | Δ Aktier (%) |
Rapporteret Værdi ($1000) |
Δ Værdi (%) |
Port Alloc (%) |
|
|---|---|---|---|---|---|---|---|---|---|---|
| 2026-02-06 | 13F | Larson Financial Group LLC | 24.420 | 0,08 | 458 | -16,76 | ||||
| 2026-02-13 | 13F | SRS Capital Advisors, Inc. | 207 | 4 | ||||||
| 2026-03-06 | 13F | Hsbc Holdings Plc | 86.895 | 37,69 | 1.629 | 14,72 | ||||
| 2025-11-14 | 13F | Cubist Systematic Strategies, LLC | 59.999 | 1.350 | ||||||
| 2026-02-13 | 13F | Atlas Capital Advisors Llc | 6.705 | 0,00 | 126 | 2,46 | ||||
| 2026-02-17 | 13F | Brevan Howard Capital Management LP | 0 | -100,00 | 0 | |||||
| 2026-04-13 | 13F | True Wealth Design, LLC | 118 | 521,05 | 2 | |||||
| 2026-02-13 | 13F | Citigroup Inc | 413 | 113,99 | 8 | 75,00 | ||||
| 2026-02-17 | 13F | Qube Research & Technologies Ltd | 0 | -100,00 | 0 | |||||
| 2026-02-13 | 13F | Marshall Wace, Llp | 0 | -100,00 | 0 | |||||
| 2026-04-07 | 13F | Farther Finance Advisors, LLC | 469 | 369,00 | 8 | 600,00 | ||||
| 2026-04-20 | 13F | Jfs Wealth Advisors, Llc | 30 | -34,78 | 0 | |||||
| 2025-11-14 | 13F | Point72 Hong Kong Ltd | 156.178 | 3.514 | ||||||
| 2025-11-14 | 13F | Davidson Kempner Capital Management Lp | 0 | -100,00 | 0 | -100,00 | ||||
| 2026-02-14 | 13F | Rockefeller Capital Management L.P. | 0 | -100,00 | 0 | |||||
| 2026-02-17 | 13F | Tower Research Capital LLC (TRC) | 4.738 | 75,68 | 89 | 46,67 | ||||
| 2026-02-12 | 13F | Jane Street Group, Llc | Call | 85.500 | -11,03 | 1.603 | -25,86 | |||
| 2026-02-12 | 13F | Jane Street Group, Llc | 123.133 | -64,92 | 2.309 | -70,77 | ||||
| 2026-02-12 | 13F | Marex Group plc | 37.900 | 711 | ||||||
| 2026-02-13 | 13F | Ubs Asset Management Americas Inc | 98 | -96,54 | 2 | -98,41 | ||||
| 2026-02-17 | 13F | Advisor Group Holdings, Inc. | 367 | -0,81 | 7 | -25,00 | ||||
| 2026-02-12 | 13F | Jane Street Group, Llc | Put | 18.700 | -6,50 | 351 | -22,22 | |||
| 2026-04-06 | 13F | Versant Capital Management, Inc | 52 | 1 | ||||||
| 2026-02-09 | 13F | Hantz Financial Services, Inc. | 8.680 | 70,63 | 0 | |||||
| 2026-02-11 | 13F | Group One Trading, L.p. | Put | 2.900 | -76,80 | 54 | -80,78 | |||
| 2026-02-13 | 13F | Y-Intercept (Hong Kong) Ltd | 0 | -100,00 | 0 | |||||
| 2026-04-21 | 13F | Venturi Wealth Management, LLC | 0 | -100,00 | 0 | |||||
| 2026-02-11 | 13F | Group One Trading, L.p. | 3.942 | 12,15 | 74 | -7,59 | ||||
| 2026-03-03 | 13F/A | Caitong International Asset Management Co., Ltd | 469 | -58,46 | 9 | -68,00 | ||||
| 2026-02-11 | 13F | Group One Trading, L.p. | Call | 56.900 | -32,10 | 1.067 | -43,45 | |||
| 2026-02-13 | 13F | Sequoia China Equity Partners (Hong Kong) Ltd | 991.297 | -0,70 | 18.587 | -17,25 | ||||
| 2026-04-02 | 13F | Byrne Asset Management LLC | 675 | 0,00 | 11 | -16,67 | ||||
| 2025-11-12 | 13F/A | Norges Bank | 2.857.356 | 5,86 | 50.118 | -2,63 | ||||
| 2026-02-13 | 13F | Infini Capital Management Ltd | 0 | -100,00 | 0 | |||||
| 2026-04-16 | 13F | SG Americas Securities, LLC | 0 | -100,00 | 0 | |||||
| 2026-02-13 | 13F | Keystone Investors Pte Ltd | 0 | -100,00 | 0 | |||||
| 2026-02-11 | 13F | Simplex Trading, Llc | Put | 6.900 | -56,05 | 129 | ||||
| 2026-01-07 | 13F | Qp Wealth Management, Llc | 0 | -100,00 | 0 | |||||
| 2026-02-11 | 13F | Simplex Trading, Llc | Call | 37.300 | 198,40 | 699 | ||||
| 2026-02-13 | 13F | Morgan Stanley | 439.596 | -23,87 | 8.242 | -36,56 | ||||
| 2026-02-13 | 13F | Van Eck Associates Corp | 183.518 | -21,95 | 3 | -40,00 | ||||
| 2026-02-17 | 13F | Blackstone Group Inc | 259.702 | 260,91 | 4.869 | 200,74 | ||||
| 2026-02-17 | 13F | Northern Trust Corp | 22.774 | 9,23 | 427 | -8,96 | ||||
| 2026-02-03 | 13F | SBI Securities Co., Ltd. | 722 | -3,99 | 14 | -18,75 | ||||
| 2026-02-17 | 13F | Schonfeld Strategic Advisors LLC | 0 | -100,00 | 0 | |||||
| 2026-02-13 | 13F | Maverick Capital Ltd | 0 | -100,00 | 0 | |||||
| 2026-01-15 | 13F | J. Safra Sarasin Holding AG | 11.747 | 220 | ||||||
| 2026-02-11 | 13F | Parallel Advisors, LLC | 245 | -42,22 | 5 | -55,56 | ||||
| 2026-02-13 | 13F | Barclays Plc | 0 | -100,00 | 0 | |||||
| 2026-01-29 | 13F | UBS Group AG | 1.208.430 | -17,80 | 22.658 | -31,50 | ||||
| 2026-02-13 | 13F | Walleye Capital LLC | Call | 6.400 | 120 | |||||
| 2026-02-13 | 13F | Walleye Capital LLC | Put | 10.800 | 202 | |||||
| 2026-02-13 | 13F | Wexford Capital Lp | 32.941 | 0,00 | 618 | -16,73 | ||||
| 2026-02-17 | 13F | Point72 Asset Management, L.P. | 852.970 | 40,75 | 15.993 | 17,30 | ||||
| 2026-02-13 | 13F | Walleye Capital LLC | 1.296 | -98,22 | 24 | -98,53 | ||||
| 2026-02-17 | 13F | Persistent Asset Partners Ltd | 36.297 | -13,89 | 681 | -28,27 | ||||
| 2026-04-13 | 13F | IFP Advisors, Inc | 7 | 0 | ||||||
| 2026-02-13 | 13F | Pinnacle Wealth Planning Services, Inc. | 336 | 6 | ||||||
| 2025-11-12 | 13F | LPL Financial LLC | 0 | -100,00 | 0 | -100,00 | ||||
| 2026-02-13 | 13F | MAI Capital Management | 341 | 0,00 | 6 | -14,29 | ||||
| 2026-04-23 | 13F | North Star Investment Management Corp. | 0 | -100,00 | 0 | |||||
| 2026-02-13 | 13F | Pinpoint Asset Management (Singapore) Pte. Ltd. | 12.951 | 243 | ||||||
| 2026-04-20 | 13F | Ronald Blue Trust, Inc. | 70 | -65,85 | 1 | -66,67 | ||||
| 2026-01-08 | 13F | Nordea Investment Management Ab | 427.717 | 5,86 | 7.994 | -12,49 | ||||
| 2026-02-13 | 13F | Rhumbline Advisers | 1.066 | -15,13 | 20 | -32,14 | ||||
| 2025-11-14 | 13F | Aigen Investment Management, Lp | 0 | -100,00 | 0 | |||||
| 2026-02-11 | 13F | Simplex Trading, Llc | 0 | -100,00 | 0 | |||||
| 2025-11-25 | 13F | Briaud Financial Planning, Inc | 0 | -100,00 | 0 | |||||
| 2026-02-10 | 13F | Goldman Sachs Group Inc | 248.113 | -8,17 | 4.652 | -23,46 | ||||
| 2026-02-12 | 13F | CIBC Private Wealth Group, LLC | 82 | 0,00 | 2 | 0,00 | ||||
| 2026-02-12 | 13F | Federation des caisses Desjardins du Quebec | 65 | 0,00 | 1 | 0,00 | ||||
| 2026-02-17 | 13F | Orbis Allan Gray Ltd | 1.792.873 | 0,70 | 33.616 | -16,08 | ||||
| 2026-04-17 | 13F | AdvisorNet Financial, Inc | 0 | -100,00 | 0 | |||||
| 2026-02-09 | 13F | Legal & General Group Plc | 274.955 | -21,99 | 5.157 | -34,96 | ||||
| 2026-02-17 | 13F | Balyasny Asset Management Llc | 115.420 | 250,15 | 2.164 | 192,04 | ||||
| 2026-02-11 | 13F | Vise Technologies, Inc. | 0 | -100,00 | 0 | |||||
| 2026-02-17 | 13F | Dv Equities, Llc | 500 | 9 | ||||||
| 2026-02-17 | 13F | Hood River Capital Management LLC | 0 | -100,00 | 0 | |||||
| 2026-02-13 | 13F | American Century Companies Inc | 133.224 | 0,00 | 2.498 | -16,68 | ||||
| 2025-11-04 | 13F | IMC-Chicago, LLC | 0 | -100,00 | 0 | -100,00 | ||||
| 2026-04-07 | 13F | Signaturefd, Llc | 237 | 11,27 | 4 | 0,00 | ||||
| 2026-02-13 | 13F | Stifel Financial Corp | 92.176 | 4,19 | 1.728 | -13,17 | ||||
| 2026-01-15 | 13F | Nisa Investment Advisors, Llc | 19 | 0 | ||||||
| 2026-02-03 | 13F | Crossmark Global Holdings, Inc. | 673.402 | 1,86 | 12.626 | -15,11 | ||||
| 2026-02-13 | 13F | Victory Capital Management Inc | 5.496 | 0,00 | 103 | -16,26 | ||||
| 2026-04-20 | 13F | Banque Cantonale Vaudoise | 3.827 | 0,00 | 62 | -13,89 | ||||
| 2026-02-17 | 13F | Royal Bank Of Canada | 0 | -100,00 | 0 | |||||
| 2026-02-13 | 13F | Squarepoint Ops LLC | 0 | -100,00 | 0 | |||||
| 2025-11-13 | 13F | Mackenzie Financial Corp | 0 | -100,00 | 0 | |||||
| 2026-04-21 | 13F | Financial Consulate, Inc | 97 | 592,86 | 2 | |||||
| 2026-02-17 | 13F | Citadel Advisors Llc | 97.116 | -22,29 | 1.821 | -35,25 | ||||
| 2026-02-17 | 13F | Citadel Advisors Llc | Call | 108.200 | -15,99 | 2.029 | -30,02 | |||
| 2026-02-12 | 13F | Long Corridor Asset Management Ltd | 105.250 | 0,00 | 1.973 | -16,68 | ||||
| 2026-02-13 | 13F | Polymer Capital Management (HK) LTD | 11.900 | -95,22 | 223 | -96,02 | ||||
| 2026-01-29 | 13F | UBS Group AG | Put | 0 | -100,00 | 0 | -100,00 | |||
| 2026-02-17 | 13F | Ameriprise Financial Inc | 15.479 | 1,38 | 290 | -15,45 | ||||
| 2026-02-10 | 13F/A | Northwestern Mutual Wealth Management Co | 177 | 0,00 | 3 | 0,00 | ||||
| 2026-04-24 | 13F | UMA Financial Services, Inc. | 18 | 0 | ||||||
| 2026-01-30 | 13F | Us Bancorp \de\ | 4.559 | 4,64 | 85 | -13,27 | ||||
| 2026-01-28 | 13F | DekaBank Deutsche Girozentrale | 19.573 | 0,00 | 0 | |||||
| 2025-11-14 | 13F | Linden Advisors Lp | 0 | -100,00 | 0 | |||||
| 2026-02-17 | 13F | KEYWISE CAPITAL MANAGEMENT (HK) Ltd | 2.290.675 | -71,41 | 42.950 | -76,17 | ||||
| 2026-02-20 | 13F | Sunbelt Securities, Inc. | 1.188 | -16,16 | 22 | -29,03 | ||||
| 2026-02-12 | 13F | Aviva Plc | 53.375 | -4,39 | 1.001 | -20,38 | ||||
| 2026-02-13 | 13F | Mariner, LLC | 13.003 | -0,18 | 244 | -16,72 | ||||
| 2026-04-17 | 13F | Bell Investment Advisors, Inc | 56 | 1 | ||||||
| 2026-01-16 | 13F | Crewe Advisors LLC | 67 | 0,00 | 1 | 0,00 | ||||
| 2026-02-06 | 13F | Gsa Capital Partners Llp | 113.895 | 8,50 | 2 | 0,00 | ||||
| 2026-01-29 | 13F | IMC-Chicago, LLC | Put | 24.500 | -27,30 | 459 | -39,45 | |||
| 2026-01-29 | 13F | IMC-Chicago, LLC | Call | 49.400 | 28,31 | 926 | 6,93 | |||
| 2026-02-17 | 13F | SageView Advisory Group, LLC | 14 | 0 | ||||||
| 2026-01-26 | 13F | Cwm, Llc | 263 | 0,00 | 0 | |||||
| 2026-02-11 | 13F | Jpmorgan Chase & Co | 25 | 150,00 | 0 | |||||
| 2026-02-13 | 13F | State Street Corp | 846.284 | -8,71 | 15.868 | -23,92 | ||||
| 2026-02-13 | 13F | Wells Fargo & Company/mn | 1.187 | 33,97 | 22 | 15,79 | ||||
| 2026-02-17 | 13F | Serenity Capital Management Pte. Ltd. | 2.024.455 | 74,87 | 37.959 | 45,73 | ||||
| 2026-02-17 | 13F | Bank Of America Corp /de/ | 168.634 | 49,24 | 3.162 | 24,35 | ||||
| 2026-02-17 | 13F | Creative Planning | 38.762 | 26,87 | 727 | 5,68 | ||||
| 2026-02-19 | 13F | Invesco Ltd. | 25.800 | 13,08 | 484 | -5,85 | ||||
| 2026-02-11 | 13F | Fox Run Management, L.l.c. | 17.915 | -68,40 | 336 | -73,73 | ||||
| 2025-11-14 | 13F | Peak6 Llc | Put | 0 | -100,00 | 0 | -100,00 | |||
| 2026-01-26 | 13F | Mirae Asset Global Investments Co., Ltd. | 3.397 | 0,47 | 64 | -17,11 | ||||
| 2026-02-12 | 13F | Ward Ferry Management (BVI) Ltd | 0 | -100,00 | 0 | |||||
| 2026-02-17 | 13F | Quantinno Capital Management LP | 62.213 | 39,34 | 1.166 | 16,14 | ||||
| 2026-02-17 | 13F | Tiger Pacific Capital LP | 0 | -100,00 | 0 | |||||
| 2026-02-12 | 13F | Skopos Labs, Inc. | 14.634 | 282 | ||||||
| 2026-02-17 | 13F | Russell Investments Group, Ltd. | 4.800 | -7,69 | 90 | -23,08 | ||||
| 2026-02-17 | 13F | Fmr Llc | 1.572 | 27,08 | 29 | 7,41 | ||||
| 2025-11-14 | 13F | Wolverine Trading, Llc | Call | 0 | -100,00 | 0 | ||||
| 2026-02-13 | 13F | Verition Fund Management LLC | 0 | -100,00 | 0 | |||||
| 2025-11-14 | 13F | Wolverine Trading, Llc | Put | 0 | -100,00 | 0 | ||||
| 2025-11-13 | 13F | Barometer Capital Management Inc. | 0 | -100,00 | 0 | -100,00 | ||||
| 2025-11-14 | 13F | Peak6 Llc | 0 | -100,00 | 0 | -100,00 | ||||
| 2026-02-11 | 13F | IMA Wealth, Inc. | 5 | 0 | ||||||
| 2026-02-10 | 13F | Bnp Paribas Arbitrage, Sa | Call | 500 | -32,43 | 938 | -43,72 | |||
| 2026-02-10 | 13F | Bnp Paribas Arbitrage, Sa | 129.491 | 515,92 | 2.428 | 413,11 | ||||
| 2025-11-14 | 13F | Sofos Investments, Inc. | 0 | -100,00 | 0 | |||||
| 2026-02-10 | 13F | Bnp Paribas Arbitrage, Sa | Put | 270 | -30,77 | 506 | -42,30 | |||
| 2026-02-18 | 13F | Vident Advisory, LLC | 29.440 | 4,91 | 552 | -12,52 | ||||
| 2025-11-14 | 13F | Weiss Asset Management LP | 0 | -100,00 | 0 | -100,00 | ||||
| 2026-02-17 | 13F | Susquehanna International Group, Llp | 18.815 | -92,57 | 353 | -93,82 | ||||
| 2026-02-17 | 13F | Susquehanna International Group, Llp | Put | 61.500 | -64,70 | 1.153 | -70,58 | |||
| 2026-02-17 | 13F | Susquehanna International Group, Llp | Call | 276.500 | 5.184 | |||||
| 2026-02-12 | 13F | Steward Partners Investment Advisory, Llc | 0 | -100,00 | 0 | |||||
| 2026-02-13 | 13F | Walleye Trading LLC | 2.494 | -81,60 | 47 | -84,92 | ||||
| 2026-02-13 | 13F | Walleye Trading LLC | Put | 28.300 | -40,67 | 531 | -50,61 | |||
| 2026-02-13 | 13F | Walleye Trading LLC | Call | 20.200 | 121,98 | 379 | 85,29 | |||
| 2026-01-22 | 13F | BOCHK Asset Management Ltd | 1.000 | 19 | ||||||
| 2025-11-12 | 13F | NewSquare Capital LLC | 0 | -100,00 | 0 | |||||
| 2026-02-13 | 13F | Macquarie Group Ltd | 6.683 | 0,00 | 125 | -16,67 | ||||
| 2025-11-07 | 13F | Alberta Investment Management Corp | 0 | -100,00 | 0 | |||||
| 2025-12-03 | 13F | Strategic Investment Solutions, Inc. /IL | 0 | -100,00 | 0 | -100,00 | ||||
| 2026-02-06 | 13F | EverSource Wealth Advisors, LLC | 2.592 | 0,19 | 49 | -17,24 | ||||
| 2026-02-17 | 13F | Voloridge Investment Management, Llc | 0 | -100,00 | 0 | |||||
| 2026-02-12 | 13F | Quadrant Capital Group Llc | 42.897 | 1,44 | 804 | -15,46 | ||||
| 2026-02-18 | 13F | VGI Partners Ltd | 0 | -100,00 | 0 | |||||
| 2026-02-10 | 13F | Envestnet Asset Management Inc | 19.652 | 2,28 | 368 | -14,81 | ||||
| 2025-11-14 | 13F | Raymond James Financial Inc | 0 | -100,00 | 0 | |||||
| 2026-02-13 | 13F | Smartleaf Asset Management LLC | 538 | 10 | ||||||
| 2026-02-17 | 13F | XTX Topco Ltd | 0 | -100,00 | 0 | |||||
| 2026-02-12 | 13F | BlackRock, Inc. | 177.530 | 6,77 | 3.329 | -11,04 | ||||
| 2026-02-10 | 13F | Quantbot Technologies LP | 1.300 | 24 | ||||||
| 2026-03-12 | 13F/A | Peak6 Llc | Call | 88.800 | -12,43 | 1.665 | -27,01 | |||
| 2026-02-17 | 13F | Engineers Gate Manager LP | 16.790 | 8,06 | 315 | -10,03 | ||||
| 2026-02-06 | 13F | Pnc Financial Services Group, Inc. | 3.591 | 44,80 | 67 | 21,82 | ||||
| 2026-02-17 | 13F | Millennium Management Llc | 1.344.121 | 38,30 | 25.202 | 15,25 | ||||
| 2025-11-13 | 13F | Tairen Capital Ltd | 0 | -100,00 | 0 | |||||
| 2026-01-23 | 13F | Assetmark, Inc | 35 | 1 | ||||||
| 2026-02-05 | 13F | Allworth Financial LP | 66 | 94,12 | 1 | |||||
| 2026-02-05 | 13F | DnB Asset Management AS | 11.449 | 0,00 | 215 | -16,73 |